Average Humidity in the Carolinas: 7 Cities, NOAA Data
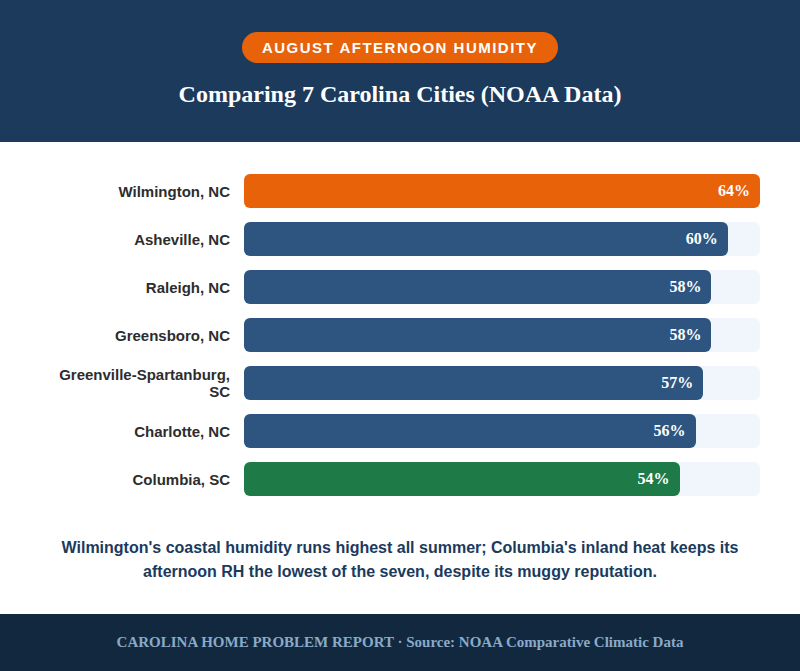
The average humidity in the Carolinas depends heavily on time of day, not just season. Using NOAA's own Comparative Climatic Data, seven NC and SC stations show morning relative humidity regularly in the 80s and 90s while the same city's afternoon reading can sit 25-38 points lower — because cooler morning air is naturally closer to its saturation point, not because there's actually more moisture in the air. Coastal Wilmington runs the muggiest afternoons (64% in August); inland Columbia, despite its swampy reputation, posts the lowest annual afternoon average (50%) because its higher temperatures push relative humidity down even when the actual moisture content is similar to its neighbors.
- ✓Data sourced directly from NOAA's Comparative Climatic Data (CCD) — the same federal dataset used for building-science and HVAC design references
- ✓Morning-vs-afternoon swings of 25-38 points are normal in the Carolinas and explained by dew point, not daily moisture change
- ✓Coastal, Piedmont, Midlands, Upstate, and Mountain regions each show a genuinely different humidity signature — "the Carolinas" isn't one climate
- ✓July and August are the peak afternoon-humidity months everywhere measured, which is exactly when AC dehumidification capacity matters most
- ✓Full monthly data for all 7 stations is below, with methodology and source link for anyone who wants to verify or cite it
This page exists because most "average humidity in North Carolina" content either quotes a single vague number for the whole state or pulls from secondary weather-aggregator sites without saying where the number actually came from. What follows is pulled directly from NOAA's own Comparative Climatic Data station records, city by city, morning and afternoon, for every month of the year — the same kind of dataset referenced throughout our humidity and HVAC guides. If you're trying to understand why your house feels humid at a specific time of day, or you're sizing a dehumidifier or AC system and want real regional numbers instead of a national average, this is the reference page for that.
The Data: 7 Carolina Stations, Morning & Afternoon
NOAA's Comparative Climatic Data reports average relative humidity twice a day for each station: a morning reading (roughly sunrise) and an afternoon reading (mid-afternoon, when temperatures peak). The table below shows each city's annual average for both, plus its single most humid month.
| City | Region | Annual Avg. Morning | Annual Avg. Afternoon | Most Humid Month (Afternoon) |
|---|---|---|---|---|
| Charlotte, NC | Piedmont | 81% | 52% | Aug/Sep — 56% |
| Raleigh, NC | Piedmont/Capital | 83% | 53% | Aug — 58% |
| Greensboro, NC | Piedmont | 81% | 53% | Aug/Sep — 58% |
| Wilmington, NC | Coastal | 84% | 56% | Aug — 64% |
| Asheville, NC | Mountains | 87% | 55% | Aug — 60% |
| Columbia, SC | Midlands | 84% | 50% | Aug/Sep — 54% |
| Greenville-Spartanburg, SC | Upstate | 81% | 53% | Aug/Sep — 57% |
Source: NOAA National Centers for Environmental Information, Comparative Climatic Data. Station periods of record vary (1948-2018 or 1962-2018 depending on station). See Methodology below.
Why Morning Humidity Reads So Much Higher
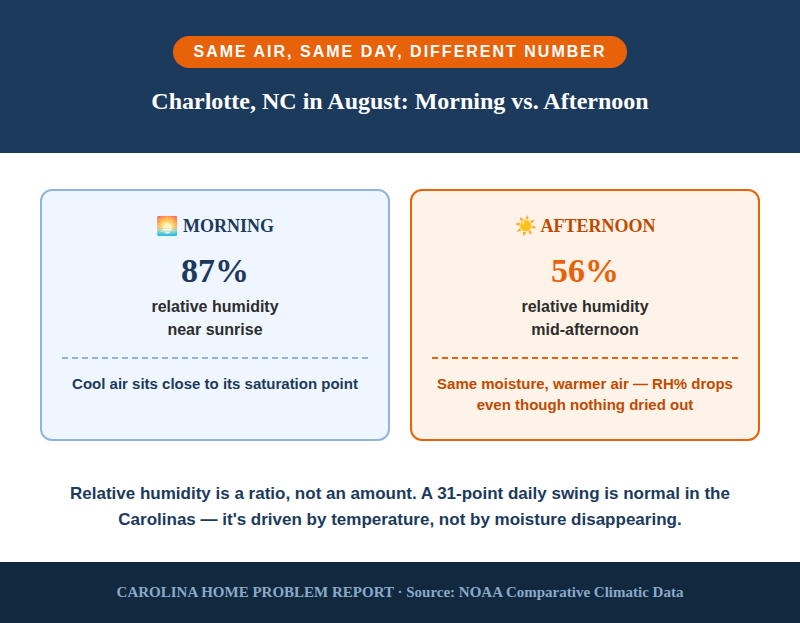
Every single station in this dataset shows the same pattern: morning relative humidity in the 75-94% range, afternoon relative humidity 25-38 points lower. That's not because the air loses moisture between 7 a.m. and 3 p.m. — the actual water vapor content (what meteorologists measure as dew point) barely changes over a few hours. What changes is temperature, and relative humidity is a ratio, not an absolute amount: it's how close the air is to its saturation point at its current temperature. Cool morning air sits close to saturation, so RH reads high. The same air, warmed by the afternoon sun, can hold more moisture before saturating, so the identical amount of water vapor now reads as a much lower percentage.
This is also why "relative humidity" alone can be a misleading way to compare cities. Columbia's 50% annual afternoon average looks drier on paper than Wilmington's 56% — but Columbia is also hotter in the afternoon, which pushes its RH down even at similar absolute moisture levels. A single RH percentage without its matching temperature doesn't tell you how much moisture is actually in the air, which is part of why our guide to HVAC sizing problems talks about sensible and latent load separately rather than relying on RH alone.
Regional Differences: Coast, Piedmont, Midlands, Upstate, Mountains
"The Carolinas" isn't one humidity climate, and the data shows real, consistent differences by region:
- Coastal (Wilmington): Highest afternoon humidity of any station, every month, and the smallest morning-to-afternoon swing. Proximity to the ocean keeps absolute moisture levels high around the clock, so temperature swings matter less. This is the region where afternoon comfort is hardest to fix with temperature alone — moisture removal (not just cooling) is doing most of the real work.
- Piedmont (Charlotte, Raleigh, Greensboro): The most "average" profile of the group — moderate morning highs, moderate afternoon lows, peak humidity in August. This is the closest thing to a single-number "Carolina average," if one number were ever accurate.
- Midlands (Columbia): Lowest annual afternoon average of the seven, driven by higher summer temperatures pushing RH down even when absolute moisture is comparable to its neighbors. Columbia's reputation for being "swampy" is really about heat plus humidity together, not humidity alone.
- Upstate (Greenville-Spartanburg): Very close to the Piedmont profile, slightly drier in spring, consistent with its higher elevation relative to Columbia.
- Mountains (Asheville): Highest morning readings of any station (94% in July/August) but a mid-pack afternoon number — the biggest gap between "how humid it feels at sunrise" and "how humid it feels at 3 p.m." of any region measured.
Full Monthly Data by City
Complete month-by-month figures for all seven stations, morning and afternoon relative humidity, as reported by NOAA. Use these to check your specific month rather than relying on the annual averages above.
Morning Relative Humidity (%) by Month
| City | Jan | Feb | Mar | Apr | May | Jun | Jul | Aug | Sep | Oct | Nov | Dec |
|---|---|---|---|---|---|---|---|---|---|---|---|---|
| Charlotte, NC | 78 | 76 | 76 | 76 | 80 | 81 | 84 | 87 | 87 | 86 | 83 | 79 |
| Raleigh, NC | 79 | 78 | 78 | 78 | 83 | 84 | 86 | 89 | 90 | 89 | 84 | 81 |
| Greensboro, NC | 78 | 76 | 76 | 75 | 80 | 82 | 85 | 88 | 88 | 86 | 81 | 79 |
| Wilmington, NC | 81 | 81 | 81 | 79 | 82 | 83 | 85 | 88 | 89 | 88 | 85 | 83 |
| Asheville, NC | 83 | 82 | 82 | 82 | 88 | 90 | 92 | 94 | 94 | 91 | 86 | 84 |
| Columbia, SC | 82 | 82 | 82 | 81 | 82 | 83 | 86 | 89 | 89 | 89 | 87 | 84 |
| Greenville-Spartanburg, SC | 76 | 75 | 75 | 76 | 81 | 82 | 85 | 87 | 87 | 85 | 81 | 78 |
Afternoon Relative Humidity (%) by Month
| City | Jan | Feb | Mar | Apr | May | Jun | Jul | Aug | Sep | Oct | Nov | Dec |
|---|---|---|---|---|---|---|---|---|---|---|---|---|
| Charlotte, NC | 54 | 51 | 49 | 46 | 51 | 53 | 55 | 56 | 56 | 52 | 51 | 54 |
| Raleigh, NC | 53 | 51 | 48 | 46 | 53 | 54 | 56 | 58 | 57 | 53 | 51 | 54 |
| Greensboro, NC | 54 | 51 | 49 | 46 | 53 | 54 | 57 | 58 | 58 | 53 | 51 | 54 |
| Wilmington, NC | 56 | 53 | 52 | 49 | 55 | 59 | 62 | 64 | 62 | 56 | 54 | 56 |
| Asheville, NC | 57 | 54 | 51 | 48 | 54 | 57 | 60 | 60 | 59 | 54 | 53 | 57 |
| Columbia, SC | 52 | 49 | 47 | 43 | 47 | 50 | 52 | 54 | 54 | 50 | 49 | 52 |
| Greenville-Spartanburg, SC | 53 | 50 | 49 | 47 | 52 | 53 | 55 | 57 | 57 | 52 | 51 | 55 |
What This Means for Your Home
A few practical takeaways from the regional data:
- Sizing a dehumidifier or AC? Use your city's August afternoon figure, not the annual average — that's the load your system actually has to handle on the worst days, and it's the number that should inform decisions covered in our dehumidifier sizing guide.
- Coastal homeowners (Wilmington-area) are dealing with a genuinely tougher humidity load than Piedmont or Upstate homeowners — the data backs up what coastal residents already feel, and it's worth factoring into equipment decisions rather than assuming a system sized for Charlotte works the same way at the coast.
- "My house feels humid even though the weather app says 50%" is usually a morning-vs-afternoon confusion, or an indoor-vs-outdoor one — outdoor RH and indoor RH are different numbers driven by different mechanisms, which is exactly the distinction covered in humidity even with AC running.
Key Facts for Carolina Homeowners:
- August is the peak humidity month at every station measured — plan equipment sizing around it, not the annual average
- Coastal homes (Wilmington) face the highest sustained afternoon humidity in the dataset
- A city's "average humidity" isn't one number — morning and afternoon can differ by 25-38 points
- Use the full monthly table above to find your specific region's numbers
Methodology & Source
All figures on this page come directly from the NOAA National Centers for Environmental Information's Comparative Climatic Data (CCD) product, specifically its "Average Relative Humidity: Morning (M), Afternoon (A)" table. Morning observations are taken at a fixed local standard time (roughly sunrise, varying slightly by station); afternoon observations are taken in the mid-afternoon, near the daily temperature peak. Station periods of record range from 1948-2018 to 1962-2018 depending on the specific station. Charleston, SC is not included because it does not appear as an individual station in NOAA's CCD dataset; Columbia and Greenville-Spartanburg represent South Carolina in this comparison. We link directly to the NOAA source above so anyone citing this page can verify the underlying numbers themselves.
Frequently Asked Questions
There isn't one honest single-number answer. Across the seven stations measured, annual average morning humidity runs 81-87% and annual average afternoon humidity runs 50-56%, with real differences by region and by time of day. The full data above breaks it down by city and month rather than flattening it into one misleading average.
Weather apps show a live, current reading at a specific moment. This page shows long-term averages (decades of data) for a fixed morning and afternoon time. Your app's number on any given day can be higher or lower than the historical average shown here — both can be correct at the same time.
By afternoon relative humidity — the number that best reflects how humid a day actually feels — Wilmington, NC is the most humid of the seven stations measured, averaging 56% annually and peaking at 64% in August. Asheville has the highest morning readings, but its afternoon numbers are closer to the middle of the pack.
We research and verify home-problem solutions specific to Carolina homes and climate, so you can fix issues right the first time — or know exactly what to ask a pro before you hire one.
Data on this page is drawn from NOAA's Comparative Climatic Data and reflects long-term historical averages, not real-time conditions. This article is for general informational purposes and is not a substitute for a site-specific HVAC or building assessment.